


Slope Fields with Mathematica
Tweaking The Preliminary Example
(continued from last page...)
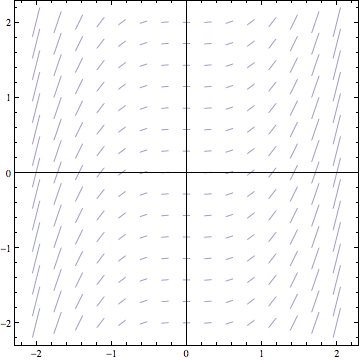
This time your trip to Mathematica should have yielded a result like the following:
OK, we have nearly concluded learning the basics of tweaking a slope field generated by Mathematica to look exactly as we wish. What else could we choose to alter about our picture? Well, there are several things. We could change its color. We could change the number of vectors that are plotted. We could remove the border around the image, play with the labels on the axes, alter the tick marks on the axes, or change the aspect ratio of the plot. To see all of the possible controls you could play with, if you wish, try entering the command Options[VectorPlot].
For our purposes, however, there is very little more that we need to have the ability to control.
One aspect of the plot that may be bothering you is the varying lengths of the vectors shown. These different magnitudes mean something in the broader field of vector calculus, but for us this variation is actually a little annoying. We can use the VectorScale option to make all of the vector lengths equal.
We may also wish to use a larger or lesser number of vectors in the plot, as this may give us a better feel for the true shape of the solutions. This is controlled by the VectorPoints option. Mathematica defaults to plotting a 15 X 15 grid of vectors, (for a total of 225 vectors.) Say we wanted this to become 20 X 20. (For a total of how many vectors?)
Implementing both of the changes mentioned above, we would change our previous command to:
VectorPlot[{1, x^2}, {x, -2, 2}, {y, -2, 2},
VectorStyle -> Arrowheads[0], Axes -> True,
VectorScale -> {Tiny, Automatic, None}, VectorPoints -> 20]
(I don't want to spend too much time here dwelling on the details of the VectorScale command, so just use it as given above from now on to make all of your vectors have the same length.) Go ahead and switch to Mathematica and try this, returning here when you are done.
Welcome back. Let's look at what the new graph should have been like...
 |
If you're lost, impatient, want an overview of this laboratory assignment, or maybe even all three, you can click on the compass button on the left to go to the table of contents for this laboratory assignment. |