Slope Fields with Mathematica
Tweaking The Preliminary Example
(continued from last page...)
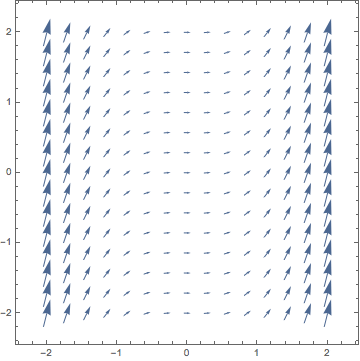
Hopefully you successfully managed to get a reasonable picture of a slope field during your little trip over to Mathematica. The slope field you got should have been very much like the following:

The fact that we got a slope field at all, without having to do huge numbers of calculations by hand, is somewhat encouraging, but there are a couple of things about this plot that could use some improvement. First, the VectorPlot command seems to default to drawing little arrow heads on each vector that it renders. While this is useful when studying vectors in their own right, in the context of slope fields, these are less necessary, (though they do have their uses,) and to some extent they clutter the image. Second, it looks like VectorPlot defaults to leaving the x- and y-axes off of the graph. Let's deal with these complaints by adding some options to the VectorPlot command we used on the last page, as follows:
VectorPlot[{1, x^2}, {x, -2, 2}, {y, -2, 2},
VectorStyle -> Arrowheads[0], Axes -> True]
The two options we've added are self-explanatory. The first says that the arrow heads should be left off, and the second asks for the axes to be included.
Switch back to Mathematica and enter the above command, looking carefully at the resulting graph, then return here.
Let's now go and see what you should have gotten this time.


