


Slope Fields with Mathematica
Our Preliminary Example in Mathematica
(continued from last page...)
Mathematica should have responded with the following description of the VectorPlot command:
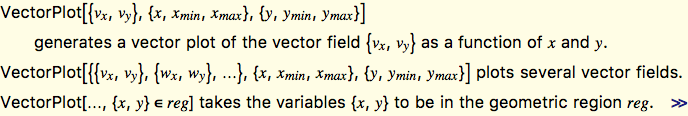
The first of these three versions of the command is more than enough for the simple task we have in mind. If you have not yet taken vector calculus, then some explanation is in order. The description refers to a vector field {vx,vy}. The notation here is a little confusing to the novice. A vector field, in this context, can be thought of as being defined by a two dimensional vector function {vx,vy}, which has two coordinates, vx and vy, where each of these can be functions of both x and y in their own right!
Now we wish to use VectorPlot to create the slope fields we've been discussing since the start of the lab! We want the vectors that it draws for us to all have the slope dictated by the original differential equation at each individual point, (x, y).
Recall that the introductory differential equation we've been using so far is:
For this equation we would like the vectors plotted by VectorPlot to have a slope of x2 at each and every point (x, y) chosen to be part of our plot. Since slope is so easy to think about as rise/run, we could think of the slopes that we're seeking here as being x2/1, i.e. having a rise of x2, and a run of 1.
A few minutes ago I referred to the vector valued function,{vx,vy}. Here, the first coordinate, vx, dictates the length of each vector in the x-direction, and the second coordinate, vy, dictates the length of each vector in the y-direction, i.e. using this terminology, our vectors will have a rise of vx, and a run of vy. But we've just said that for our example we want our slope-field vectors to have a rise of x2, and a run of 1. This would be achieved if we simply let
vy= x2,
and
vx = 1.
So, making these substitutions into the VectorPlot syntax discussed above, and taking into account that we had also suggested we plot a slope field with bounds:
our first example would require us to type:
VectorPlot[{1,x^2}, {x, -2, 2}, {y, -2, 2}]
Switch over to Mathematica now, and either copy and paste or type the above command, hitting ENTER to evaluate it. Come back here when you're done.
Let's now go and see what you should have gotten.
 |
If you're lost, impatient, want an overview of this laboratory assignment, or maybe even all three, you can click on the compass button on the left to go to the table of contents for this laboratory assignment. |