Solving the Preliminary Example
continued from last page...)
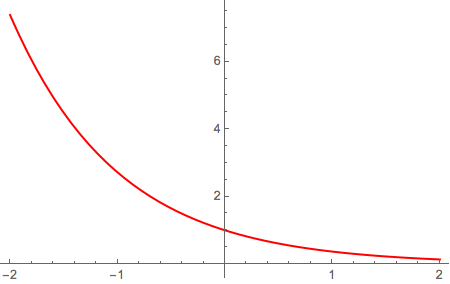
Your plotting should have gone like this:
prelimxplot=Plot[prelimx,{t,-2,2},
PlotStyle->RGBColor[1,0,0]]

which looks like a perfectly reasonable solution, but we don't really know what we were expecting. One thing we could do, however, is compare this graph to the graph of the solution we proposed back in the introduction.
In the introduction we proposed that x(t) = e- t is the x-component of a solution, and I later revealed that it even obeyed the same initial conditions as the ones we are currently using. What we can now do is plot this function's graph in blue, and then superimpose the two pictures. Let's read the new picture into the variable proposedxplot. The command we need would be:
proposedxplot=Plot[E^(-t), {t,-2,2},
PlotStyle->RGBColor[0,0,1]]
Go to Mathematica and try it, then come back.
We'll now go look at what you should have gotten...


